How to Graph a Linear Equation on a Grid
A linear equation creates a visual bridge between algebra and geometry. While looking at an equation like y = 2x – 3 gives you numerical rules, drawing that equation on a coordinate grid transforms abstract symbols into a clear, continuous line that reveals patterns at a glance. Graphing linear equations is essential for interpreting trends in economics, plotting motion in physics, and visualizing data in computer programming. When you need to verify slope and coordinate plots quickly, an online CalcSolver graphs and solves coordinates instantly.
A linear equation is an algebraic equation whose graph on a Cartesian coordinate plane is always a perfectly straight line. Every point (x, y) that sits on that line represents a true solution to the equation.
The Slope Intercept Form y equals mx plus b
The most straightforward and popular format for graphing any straight line is the slope-intercept form:
y = mx + b
Each component of this equation provides a direct graphical instruction:
- m represents the Slope of the line, which measures its steepness and direction. It is defined as the vertical change (rise) divided by the horizontal change (run).
- b represents the y-intercept, which is the exact point (0, b) where the line crosses the vertical y-axis.
- x and y are coordinate variables representing any valid point along the straight line.
Step by Step Method to Graph Any Line
Graphing a line using slope-intercept form requires only three simple steps:
Also read: How to Solve Basic Linear Equations Finding X
You may also like: Understanding Variables and Constants in Algebra
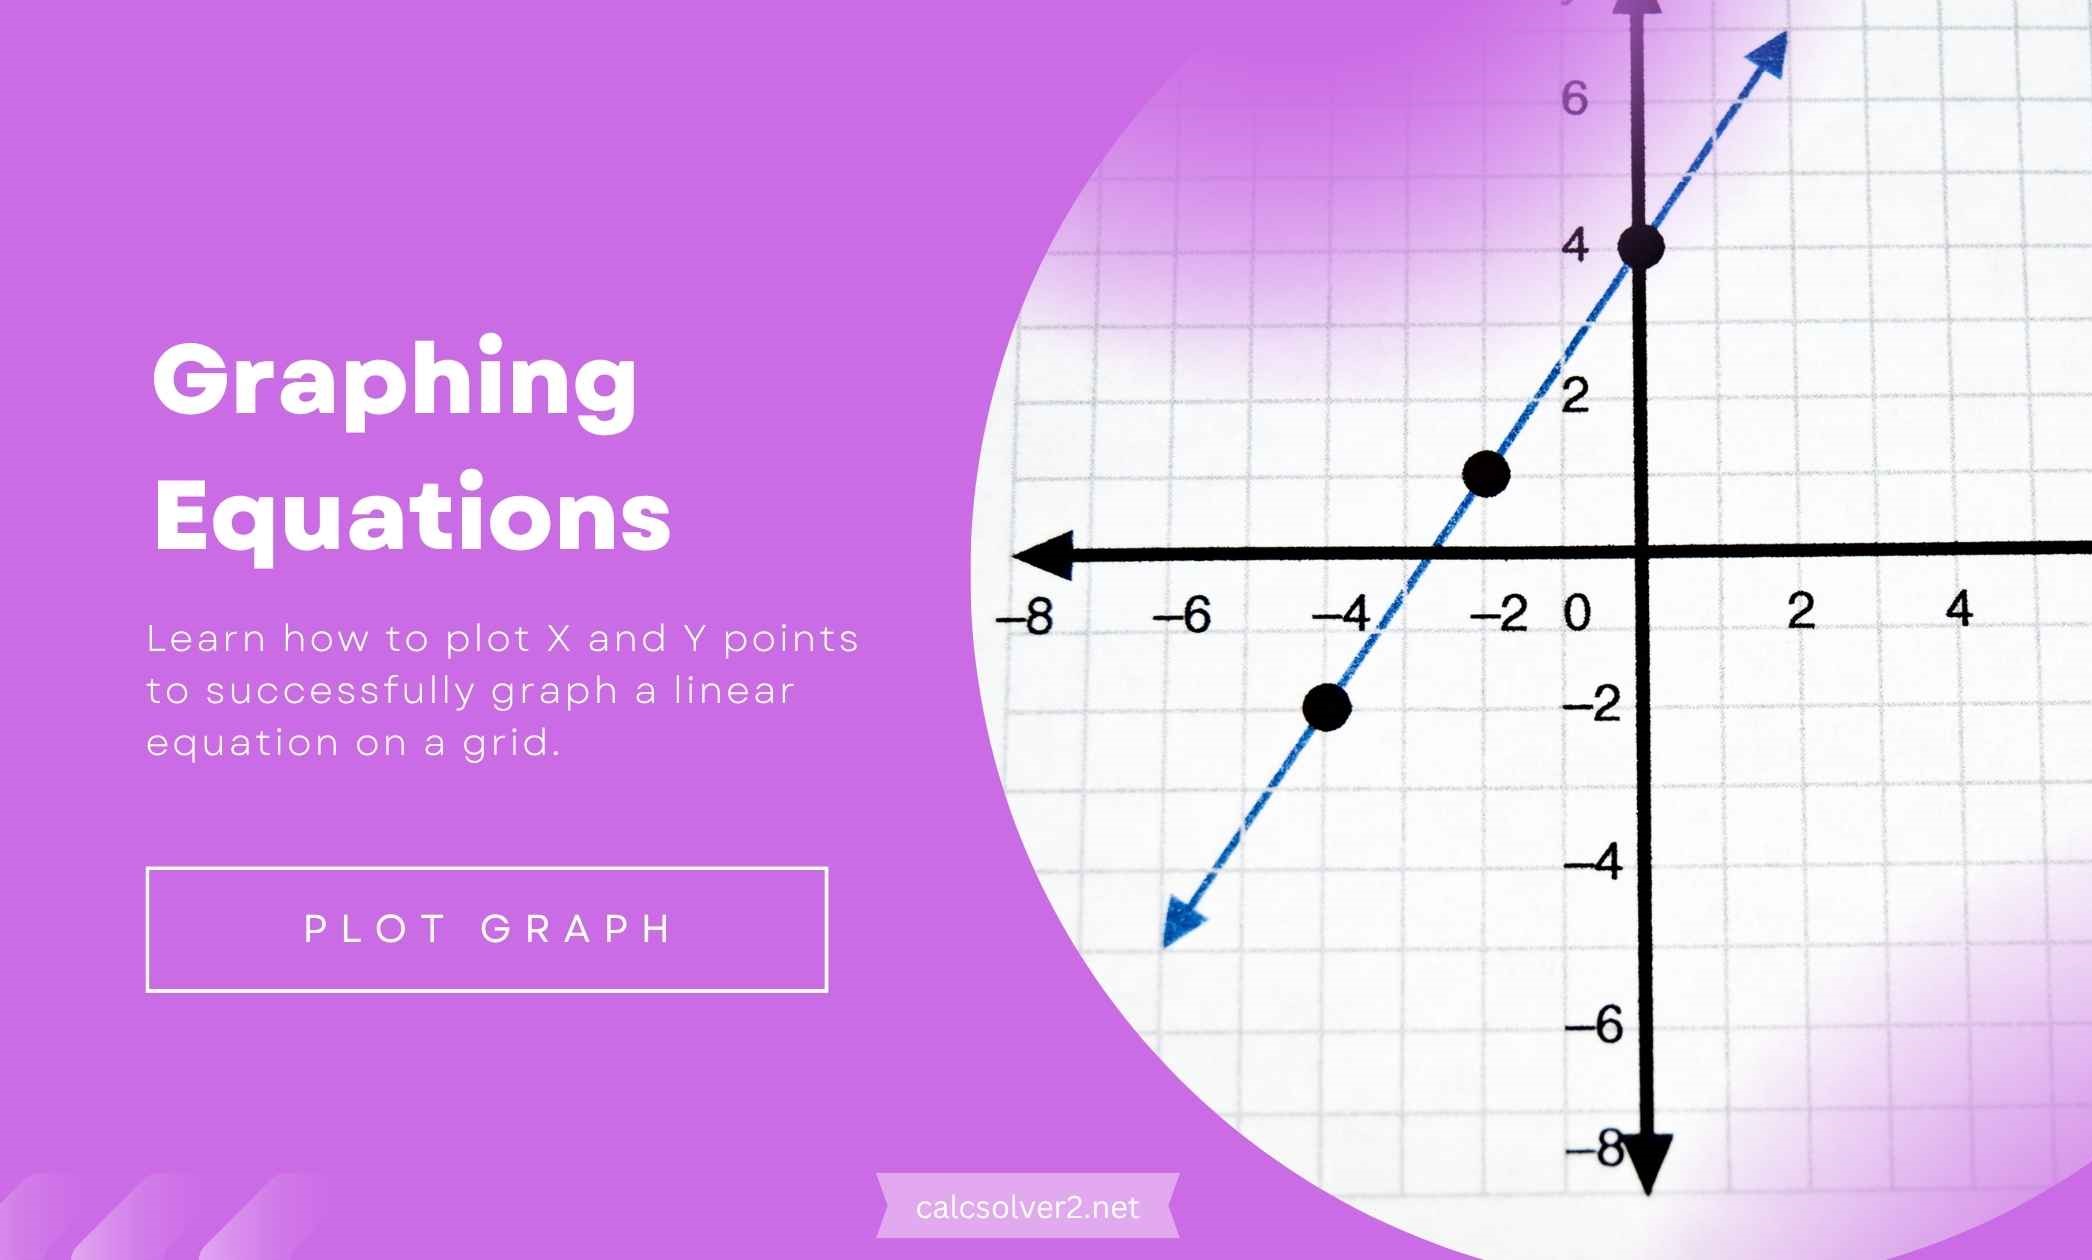
- Plot the y-intercept: Look at the value of b. Place a point directly on the vertical y-axis at (0, b). This is your starting anchor point.
- Use the slope to find the second point: Interpret m as a fraction: Rise over Run. From your y-intercept point, count vertically by the rise (up for positive, down for negative), and count horizontally to the right by the run. Plot your second point there.
- Draw the line: Use a straightedge ruler to connect your points, and place arrowheads on both ends to show that the line extends infinitely in both directions.
Let us graph y = (3/4)x – 2. First, locate the y-intercept b = -2. Plot a point at (0, -2) on the vertical axis. Next, examine the slope m = 3/4. The rise is +3 and the run is +4. From (0, -2), count up 3 units and right 4 units, arriving at the coordinate (4, 1). Plot this second point. Finally, draw a straight line through both points.
| Linear Equation | Slope (m = Rise/Run) | Y-Intercept Point (b) | Second Plotted Point | Direction of Line |
|---|---|---|---|---|
| y = 2x + 1 | 2 / 1 (up 2, right 1) | (0, 1) | (1, 3) | Slopes upward to right |
| y = -3x + 4 | -3 / 1 (down 3, right 1) | (0, 4) | (1, 1) | Slopes downward to right |
| y = (1/2)x – 3 | 1 / 2 (up 1, right 2) | (0, -3) | (2, -2) | Gentle upward slope |
| y = – (2/3)x | -2 / 3 (down 2, right 3) | (0, 0) – Origin | (3, -2) | Passes through center |
Graphing Special Horizontal and Vertical Lines
Two types of linear equations frequently confuse students because they contain only one variable instead of both x and y:
Equations in the form y = c (such as y = 4) represent horizontal lines with a slope of zero. Every point on the line has a y-coordinate of 4, regardless of x. It runs completely flat and parallel to the horizontal x-axis.
Equations in the form x = c (such as x = -2) represent vertical lines. Every point on the line has an x-coordinate of -2. Because horizontal change (run) is zero, and division by zero is undefined, the slope of a vertical line is formally undefined. The line runs straight up and down, parallel to the vertical y-axis.
Graphing Using X and Y Intercepts
When an equation is written in standard form Ax + By = C, graphing by finding both intercepts is often faster than converting to slope-intercept form:
- Find the x-intercept: Set y = 0 and solve for x. For 3x + 2y = 12: 3x = 12, so x = 4. Plot (4, 0).
- Find the y-intercept: Set x = 0 and solve for y. 2y = 12, so y = 6. Plot (0, 6).
- Connect the two points with a straight line.
Common Graphing Mistakes to Avoid
Keep these common pitfalls in mind when plotting lines:
- Inverting slope rise and run: Slope is Rise (vertical change) over Run (horizontal change). Counting run first or putting horizontal change in the numerator causes the line to slant incorrectly.
- Plotting the y-intercept on the x-axis: The y-intercept b must always be plotted on the vertical y-axis. Placing it on the horizontal axis reverses the line completely.
- Handling negative slopes: A negative sign can go with the numerator (down and right) or denominator (up and left), but never both. Applying negative signs to both directions creates a positive slope.
Mastering slope-intercept form and intercept plotting makes graphing linear equations quick, visual, and completely accurate.